Core Web Vitals: Measure and improve LCP, INP and CLS
· PoolByte
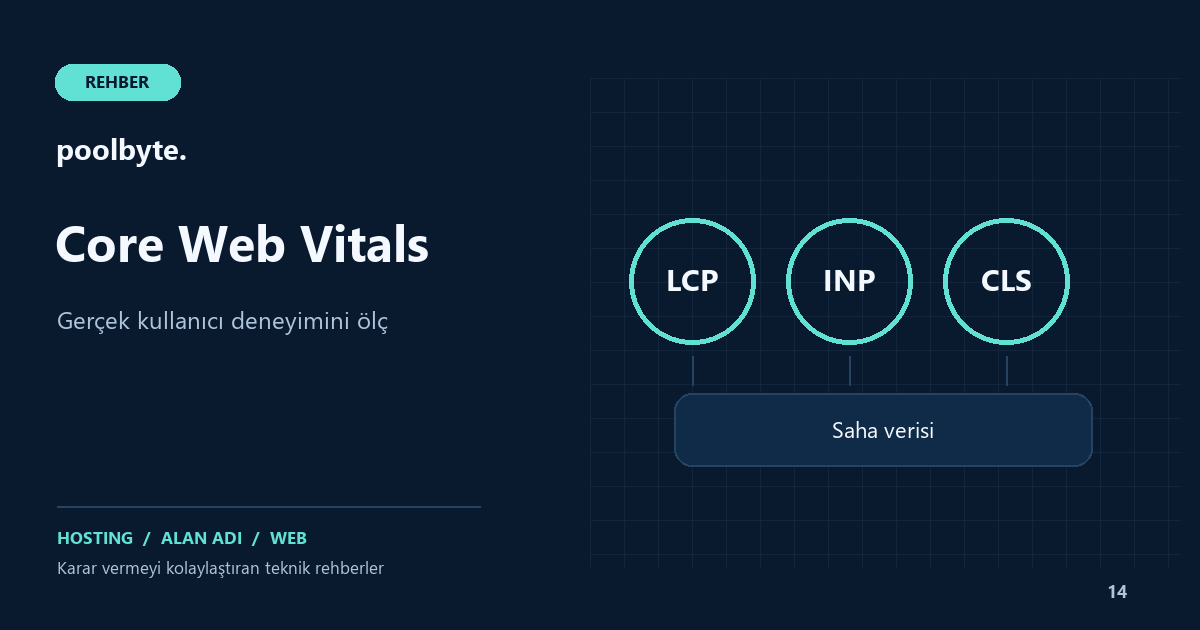
A fast page is not just about the first file arriving quickly. When does the visitor see the main content, how long does he wait when he presses the button, and does the area he is trying to read change location? Core Web Vitals measures three different parts of this experience with LCP, INP, and CLS. Evaluating metrics separately prevents applying the wrong solution to the wrong problem.
For example, the image of your home page may load quickly, but when you tap on the mobile menu, the phone may hang for a short time. While the interaction is fluid on another page, a subsequent banner may push the payment button down. A single overall score does not explain the root cause of these two problems.
What do current thresholds say?
In the web.dev documentation checked on October 11, 2026, the good experience thresholds are:
- LCP: 2.5 seconds or less.
- INP: 200 milliseconds or less.
- CLS: 0.1 or lower.
Evaluation is made on the 75th percentile of page views, considering mobile and desktop separately. Just because one metric is good doesn't mean the others are good too. Follow all three together. For the current version of the thresholds, see the official documentation at the end of the article.
The percentile is not the average. Hypothetically, if the LCP value of seventy-five out of a hundred visitors meets the target, and the remaining are higher, you need to investigate the group of users experiencing the slow experience. Knowing which device, page type, and link are affected makes for a more functional decision than the general average.
LCP: When does the main content appear?
LCP tracks drawing content, such as an image, text block, or video, that is largest in the visible area. A large cover image would be a candidate for most designs; but it is not the same element on every page. Don't just focus on reducing all images without seeing which element is LCP in the measurement report.
Break the chain of slowness: initial server response, discovery of the source, download and display of the image. If the server responds late, the priority is the application and hosting side. If a large image is requested late, resource discovery may be delayed due to HTML, styling or JavaScript. Leaving the main image of the first visible area to unnecessary lazy loading should also be considered.
Prepare the image size according to the usage area. Choose the appropriate variant for the small space the phone will display instead of downloading the giant desktop file. Apply preload and high priority settings only to truly necessary resources; Making every file a priority is not a plan.
INP: How does the page respond to interaction?
INP evaluates the delay after a visitor's click, tap, and keyboard interactions until the next visual update. It is not an exact measurement of the entire duration of a button's background network operation. There may be significant main thread work that delays the initial visual feedback to the user.
Long JavaScript tasks, heavy filtering, or rendering of large screen parts can slow down response. In the product filtering example, it may be considered first to show that the selection is accepted, to divide the expensive work into small parts and to reduce unnecessary repetitions. Also measure the impact of third-party tools added to the page.
A one-time page launch may not adequately represent the INP experience. Try real paths like mobile menu, search, tabs, form errors, and add to cart. When you detect a lag in lab testing, investigate how often the same behavior is seen in visitor metrics.
CLS: How stable is the settlement?
CLS numerically expresses unexpected order shifts. Reasons such as not allocating space for a subsequently loaded image, adding an advertisement or announcement area from above, or changing the font may cause the page to move. The target shifting just as the user is about to press the button is more than just a minor visual artifact.
Specify the size or aspect ratio of images and videos in advance. Allocate appropriate space for subsequent components. Test confirmation messages, errors and cookie notifications on different screens. Just checking the first image of the screen is not enough; scrolling and delayed content are also important.
Separate field data and lab testing
Real user data seen in tools like PageSpeed Insights and the results of a controlled test answer different questions. Field data shows the experience of different devices and connections. The laboratory environment helps you reproduce the error and investigate its cause.
The lab result may change immediately after an improvement, but do not expect the field report from past visits to improve at the same time. If field data is not visible because there is not enough traffic, do not interpret this as “perfect performance”. In your own measurement, consider the scope of data you collect and user privacy.
Applicable working order
- Select the most used page types and important user paths.
- Date start values for mobile and desktop.
- Identify the element or interaction of the weak metric.
- Apply a single set of changes and test again.
- Verify protection of form, payment, and accessibility behaviors.
- Monitor the trend in field data after publication.
Hosting resources guide helps understand server constraints, CDN guide helps understand the distribution layer. To discuss which package is suitable, you can send your measurement and usage scenario to contact page.
Frequently asked questions
If the Lighthouse score is 100, is the job over?
No. Real devices, sessional streams and subsequent content are also evaluated. Good metrics support the visitor experience; Google does not guarantee ranking.
Can every problem be solved with a more powerful server?
Server response may improve, but causes such as heavy client code or unspecified image must be fixed on the application side.